Data timeline
Figuring out how data moves through a workflow is vital for pretty much all business processes. There are two complementing perspectives to this: the aggregate perspective and the individual perspective. Accode solves the aggregate perspective via metrics and various dashboards, but it’s the individual cases that often become relevant once a user starts digging into the exception cases of their workflows.
The question that is often posed: how did this specific data end up at this action and why does it look like this? The advice we always start with: check the Data timeline.
The timeline provides the following functionality:
- An overview of the actions the data has flown through and where it currently is in the workflow.
- At-a-glance view of which actions have changed the data and how the data has changed.
- Allows for comparing changes at different points in the workflow hierarchy.
The timeline modal can be opened for any data entity. The example below shows an entity that represents an invoice that has run through a workflow:
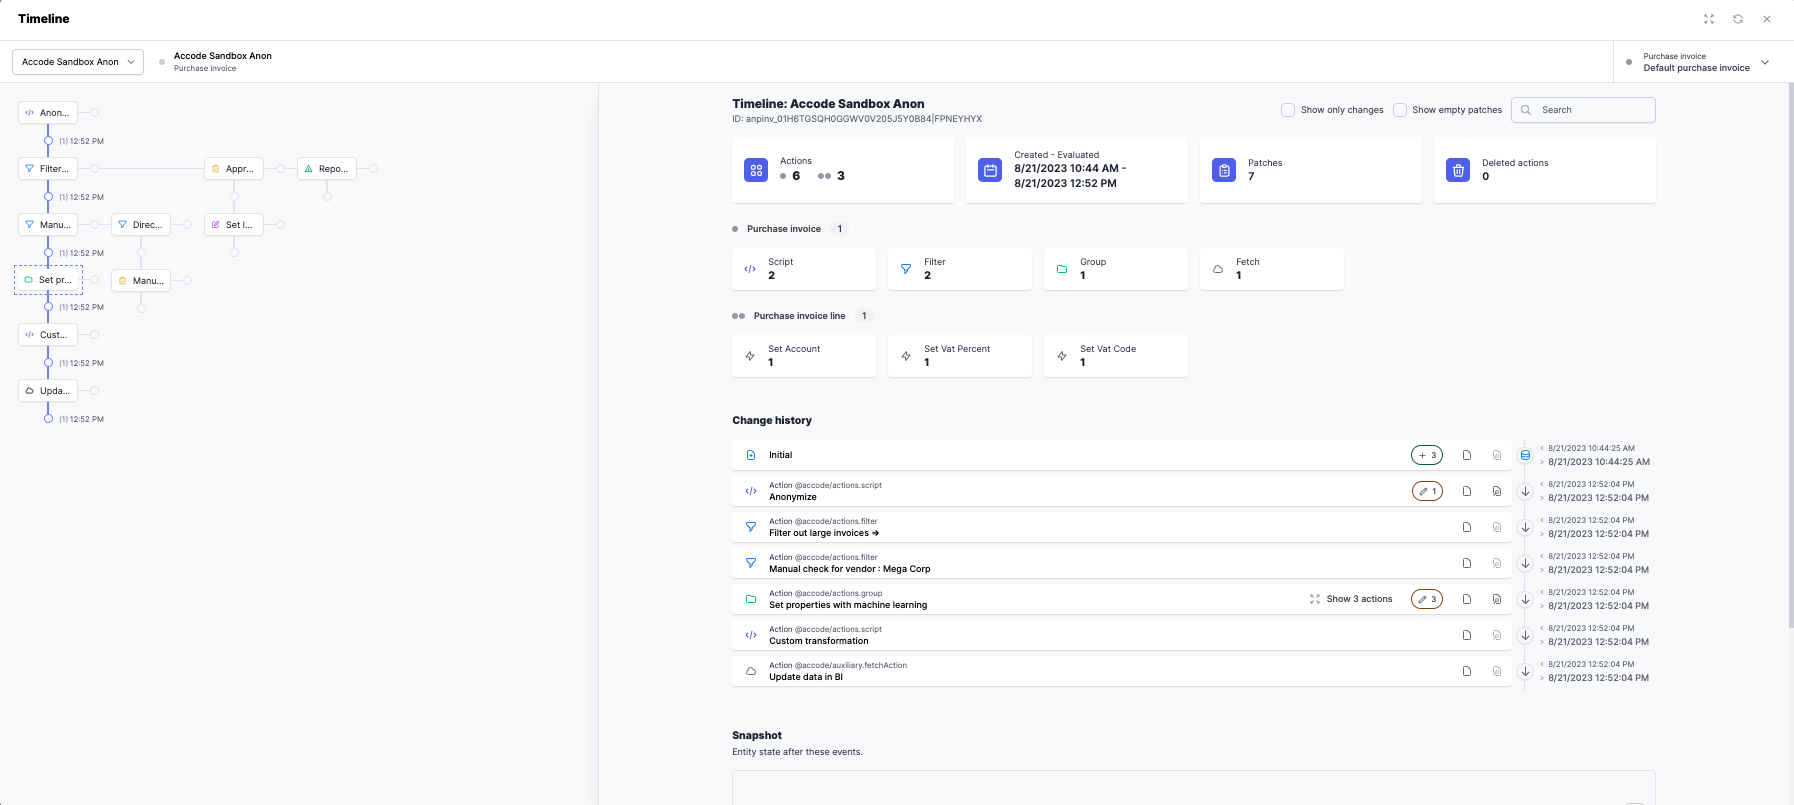
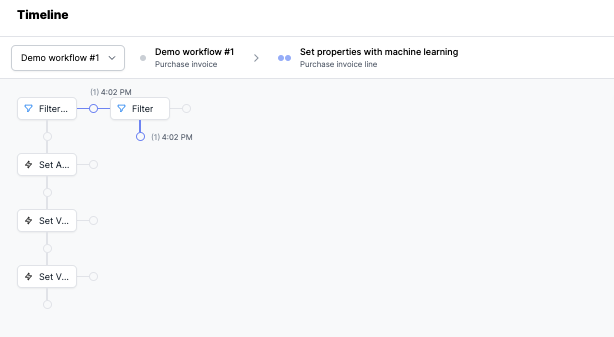
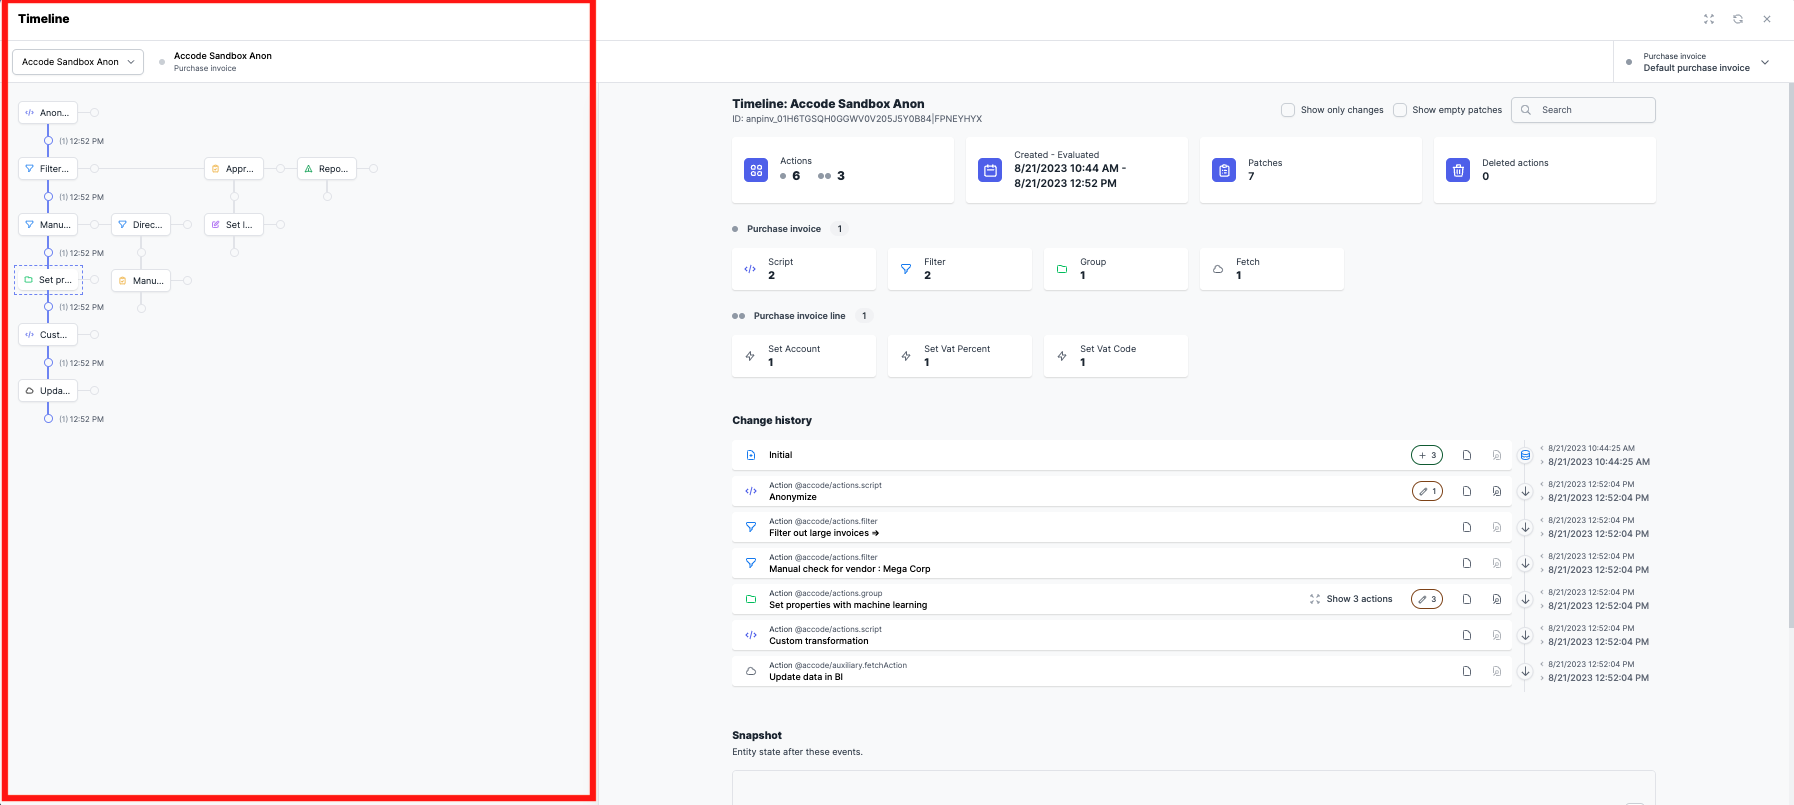
On the left side: an overview of the action path that the entity has taken in the workflow.
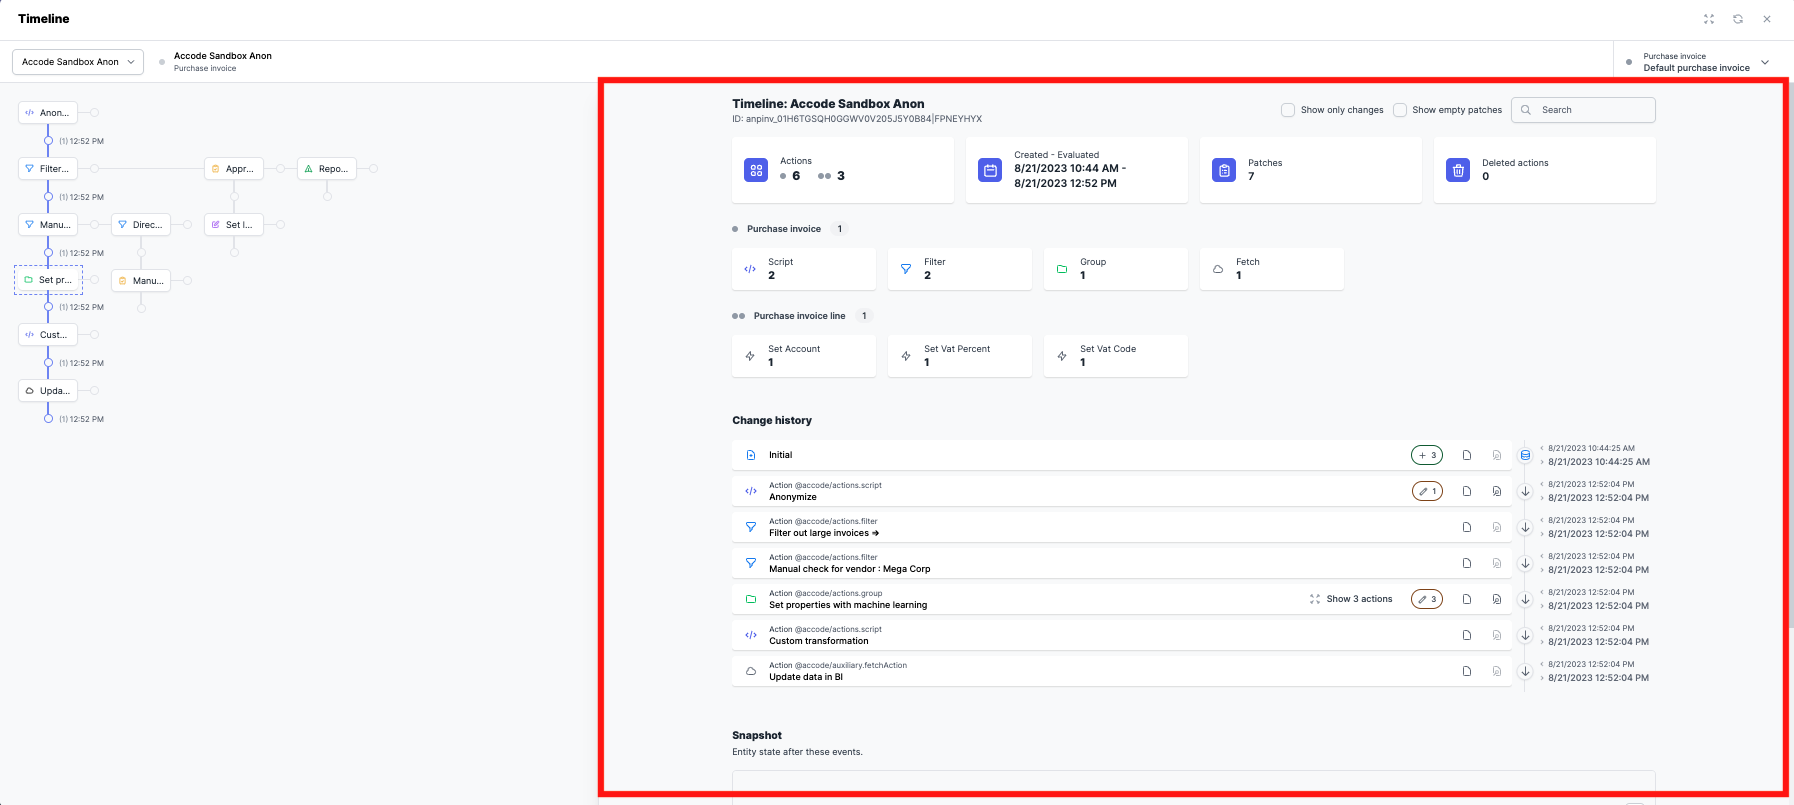
On the right side: statistics about the action path, the specific events (actions and data sync), and a snapshot of how the data looks like after these events. Events for action groups can be opened, to view the events and snapshots within the group.
In order to be able to follow what happens when, we recommend you to open the groups and see how the entities has passed through the automation. You might notice that it should have passed a filter but instead skipped it.