Metrics
Metrics are the standard method of monitoring how (much) data moves through a workflow.
Overview
Metrics allow you to measure data that has flown through an action, without affecting the action or the data itself. This allows the user to get an at-a-glance overview of how data is progressing through the workflow.
Metrics are built into an action and can be used to measure various statistics about entities that have passed through the action. For instance, the workflow builder can measure how many entities have passed through the action or compute a sum over a particular field in the data.
A useful mental model for a metric is to think of them as filter actions that count things, which are layered on top of your actual workflow.
Basics
Each action has five slots where metrics can be added. Each slot indicates a specific positions for how data moves through an action. The slots are:
- (Above) Data has entered the action
- (Below) Data has exited the action with a True outcome
- (Right) Data has exited the action with a False outcome
- (Inside) Data is currently stopped by the action
- (Error) Data has received an error in the action
By default, each action is created with a single metric in each slot, where each metric simply counts how many entities have passed that position.
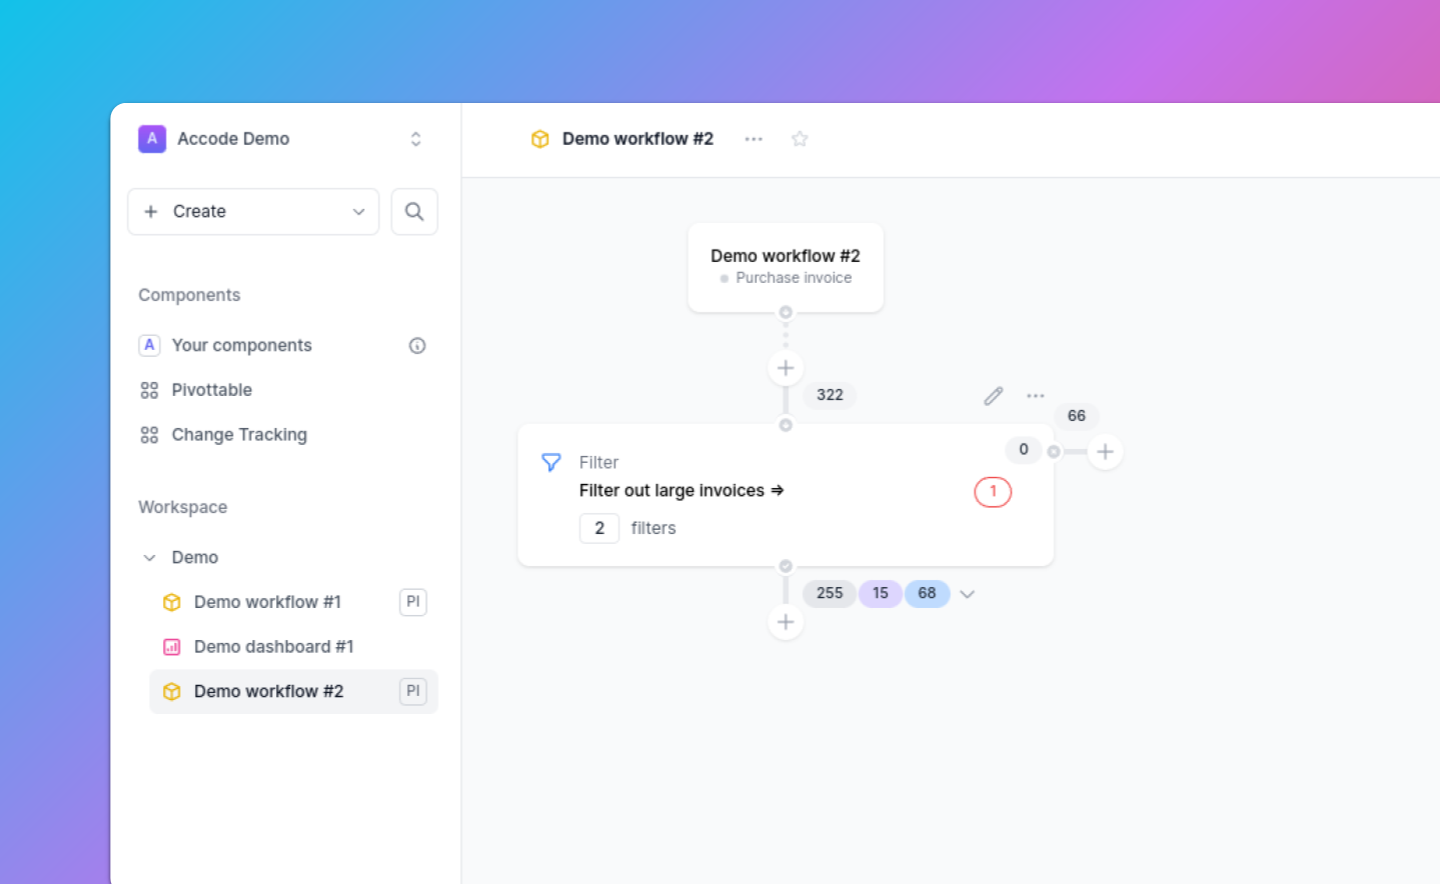
To exemplify using the screenshot above, using the Filter action from the default actions.
- The metric on top of the action (322) shows how many entities entered the action.
- On the right side (66), the metric shows how many entities that did not pass the filters in the action (a False outcome).
- The metric inside the action (0) shows entities that are currently stopped by the action (e.g. due to a time-based delay).
- The metric with the red border (1) indicates how many entities have an received an error in the action (and are thus blocked by that action).
- Finally, the metric below the action (255) shows how many entities have passed the filters (a True outcome).
Adding metrics in a workflow
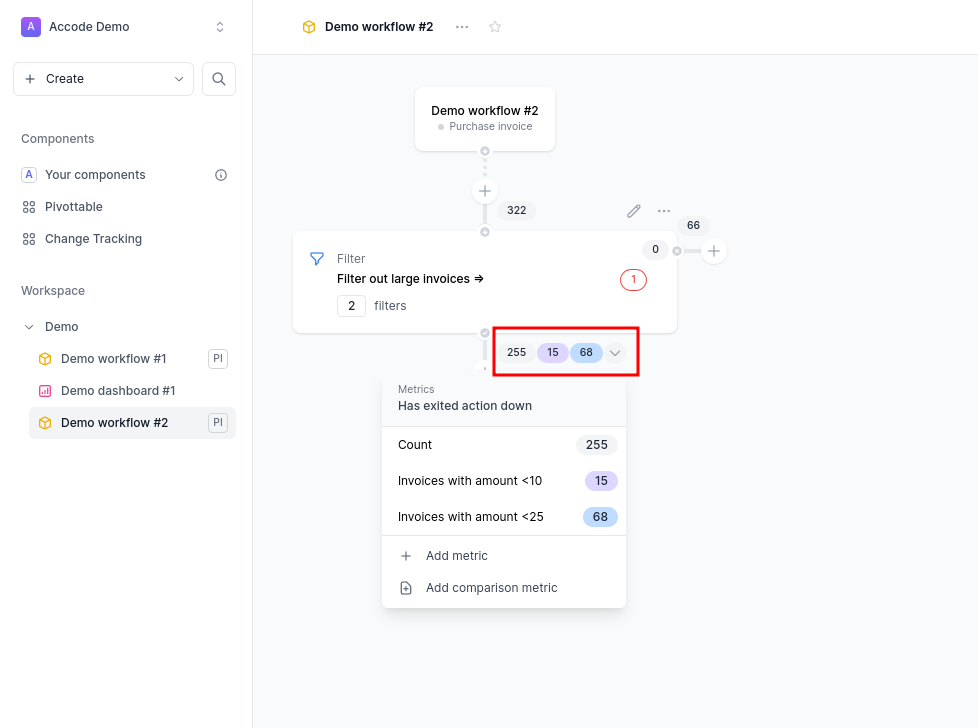
In order to add metrics to an action, find the default metric that is in the same slot as you would like to place your own metric. Press the arrow icon and a dropdown menu will open up that displays the metrics in that slot (see the screenshot above), choose Add metric and the Create metric slide-over will open on the right-hand side.

Metrics consists of four elements. On what entity level you measure it (i.e. the current entity or a nested entity level), how you calculate the metric (count, average, sum, absolute sum) and a filter function that allows you to define which entities you measure. You can also provide a custom function for calculating the metric.
After you have created your new metrics, you will have to recalculate your workflow subsets in order to populate the new metrics. You can do this by pressing on the refresh icon in the Subset menu. This will not alter any data that has been processed by the workflow.
Editing or deleting metrics
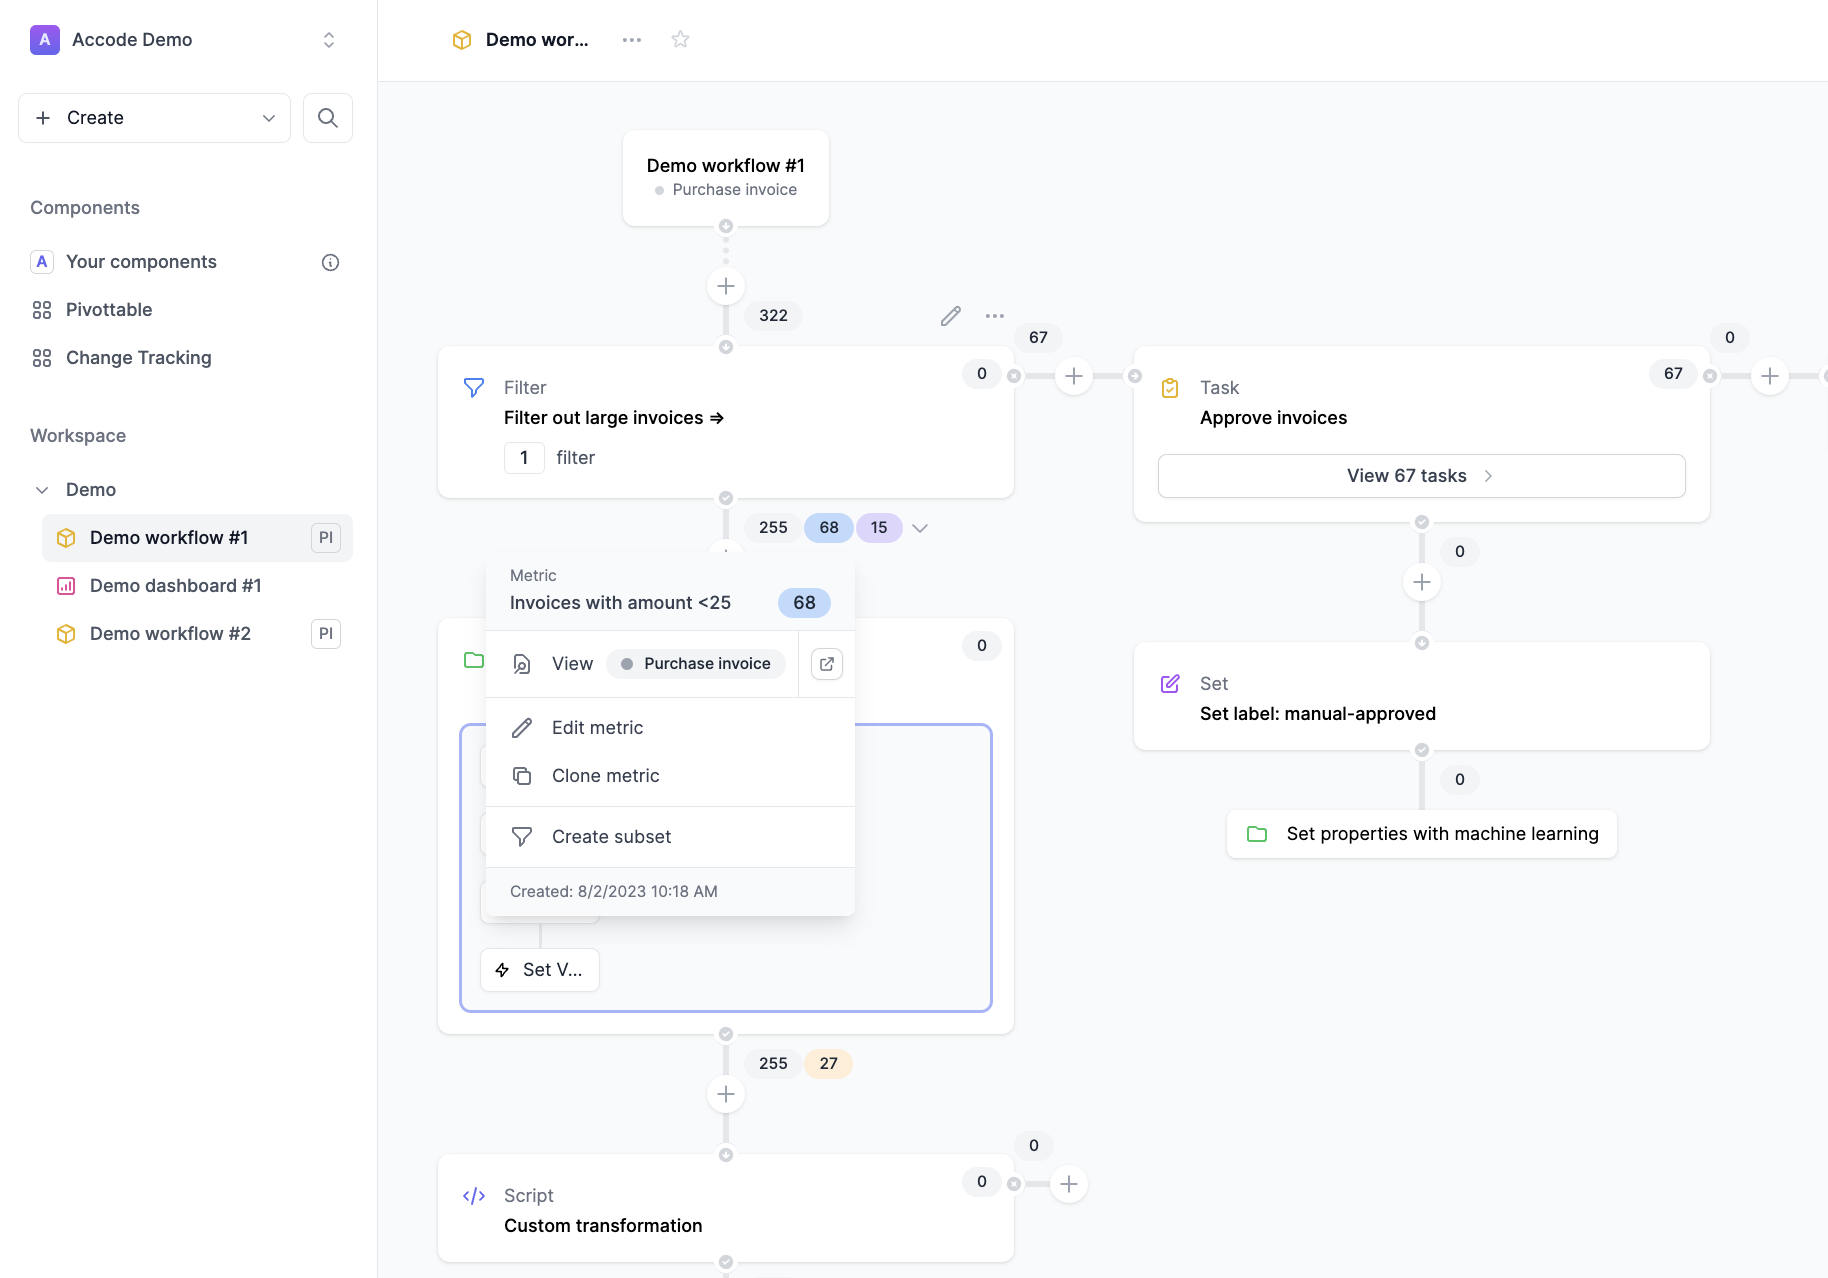
You edit your metrics by clicking on the specific metric, a menu will open up on the right-hand side that shows the set-up for that metric. In order to delete metrics, press Edit metric and then press the Delete button at the bottom of the slide-over.
Cloning metrics
If you would like to have multiple metrics with just some minor changes, it is easy to clone already existing metrics and edit them afterward. Press on the metric you would like to clone, press on “Clone metric” and the Create metric slide-over will appear from the right-hand side, with values prepopulated based on the selected metric. Edit the metric according to your needs and save it.
Comparison metric
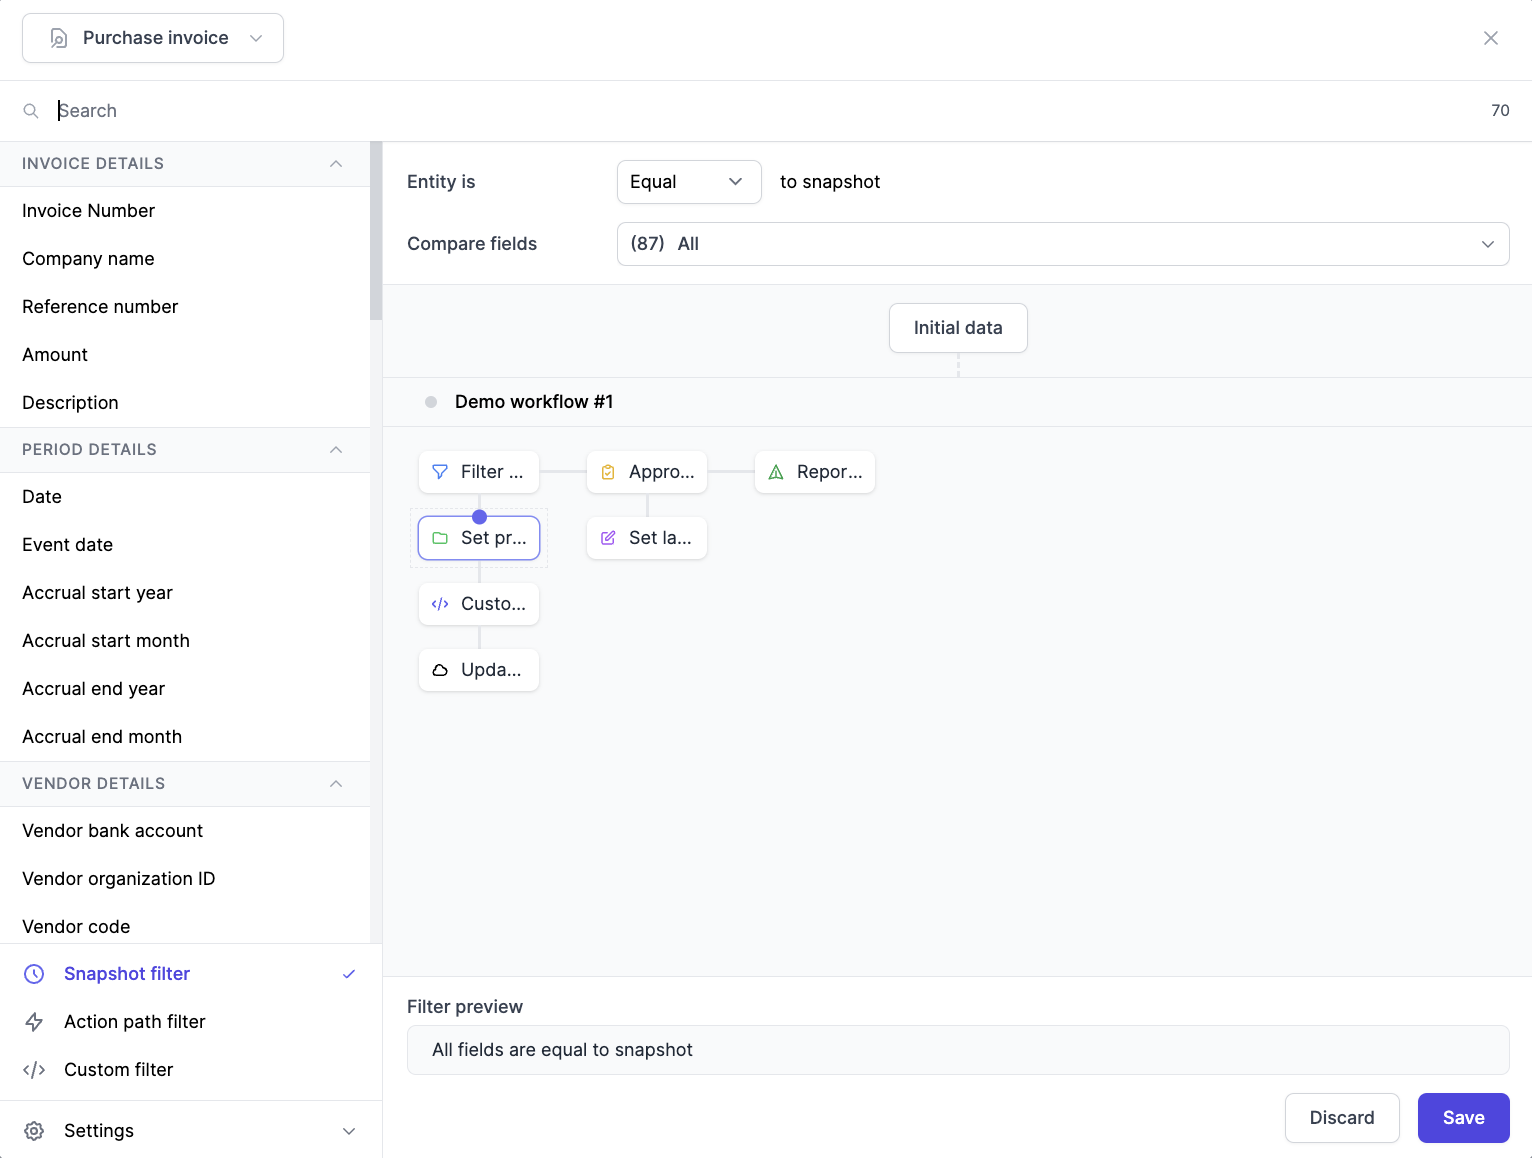
A comparison metric is added the same way as you add a normal metric. The biggest difference is the comparison that is automatically included.
By default, the comparison metric counts entities that have not changed when passing through an action.
Subsets
Subsets are global filters on a workflow that allows you to quickly switch between a set of filters.
All the metrics created in the workflow are filtered based on the currently selected subset. To exemplify, if you have e.g. set a specific time period such as “Show me only data from the last 30 days”, all the metrics will show data from that time period only.
Create a subset based on a metric
A subset can be defined based on an existing metric. This sets the new subset filters to be set based on the entities that have flown through that specific metric, as defined by the current subset. Such subsets are useful in order to track how certain entities ended up in a metric specific, including which paths they have taken through the workflow preceding that.
Check out our in-depth guide here: